 Back to Blog
If you spot a divergence on a chart, do you know what strategy to use to maximize your profits or minimize your losses? Below, we examine what divergence is, some of the situations where you might find it, and how to potentially make the most of it.
What is divergence?
Divergence is what happens when the price of a market reaches a new high or low, but a technical indicator doesn’t match the market’s movement. It usually signals that a market’s momentum may be slowing down.
Let’s say you’re using a technical indicator like the relative strength index (RSI) while trading the US Tech 100. If the index turns bullish and hits a new high, but your indicator reaches a lower high, this is called negative divergence. If the index turns bearish and reaches a new low, but your indicator shows a higher low, this is known as positive divergence.
How does momentum affect divergence in day trading?
Momentum is the length and speed of a market’s price when price action is moving in a particular direction – these are called swings. A sharp and sustained swing typically indicates strong momentum, while a shallow and short swing shows weak momentum.
Traders use momentum to find divergences, which help to determine if a trend is showing signs of weakening and can potentially create many opportunities for a savvy day trader. So, understanding momentum is, in our opinion, the key to figuring out if a divergence indicates a price reversal, retracement, a consolidation, or a false signal.
How do you trade with divergence?
You can trade using divergences by following these three steps:
Identify a divergence
Analyze the divergence
Decide on a strategy
1. Identify a divergence
Not every disagreement between the market and the indicator is a divergence. If this happens within a range where price swings are limited and erratic, it’s probably not divergence. If it happens during an active trend, you’re likely seeing a divergence, which you can aim to use to your advantage in your day trading strategy.
One way to identify if you’re seeing a true divergence is to draw lines on your chart and indicator.
Start with your price chart. If you spot a higher high or lower low, draw a line connecting the tops of the current and previous high or lows together, depending on whether the market has reached a new high or low.
Once you’ve done this, do the same on the trendline of your indicator. If the indicator has not reached the same new level as the price chart, or if your line is sloped in the opposite direction, you may be seeing a divergence.
2. Analyze the divergence
Because divergence could signal a number of market movements, you’ll need to analyze your indicator and price movements to see what the market may do next.
When there are fast rises or falls, it may be an indication that the market is overbought or oversold. This means you’ll often see a brief direction reversal but a quick return to normal levels.
Most importantly, keep in mind that a technical indicator is not 100% foolproof – nothing in trading is. It’s best to use additional indicators and analysis tools in your technical strategy to confirm a divergence and what it may mean.
For example, you could use a moving average convergence divergence (MACD) and RSI together. These two indicators measure different data – MACD measures moving averages (MA), while RSI measures price changes in relation to recent price highs and lows. Because they measure different data, you can often use one to confirm a divergence spotted in the other.
3. Decide on a strategy
Like any good day trading strategy, you’ll want trade in a way that aims to maximize profits and minimize losses. There are a few ways to react to a divergence.
If you’re already in the trade, you can take profits and exit in case the market sees a reversal. You can also enter a trade once you spot a divergence to try to take advantage of a directional change.
With Nadex, you can open a demo account and practice day trading using divergence with $10,000 in virtual funds first, before moving onto the real deal.
What indicator is best for divergence?
There are a number of technical indicators you can use to measure momentum and spot divergence, like the stochastic oscillator and the RSI.
But the most popular is the MACD, particularly for day traders as it measures recent market activity. This indicator collects data from different exponential moving averages (EMAs).
The MACD on your price chart will have three components to it:
The MACD line, which measures the distance between two EMAs. The formula for calculating this is as follows: MACD = slow period EMA - fast period EMA.
The signal line, which pinpoints changes in momentum.
The histogram, which uses bars to represent the difference between the MACD line and the signal line.
If the MACD is above the signal line, the histogram will be above the baseline, indicating a bullish market. If the MACD is below the signal line, the histogram will be below the baseline, suggesting a bearish market.
Examples using a divergence trading strategy
Let’s say you want to trade the AUD/USD forex pair using a Nadex Call Spread. You open a deal ticket in our platform and select the MACD indicator. It will automatically be set at 12 for the fast EMA period, 26 for the slow EMA period, and 9 for the signal line period. In our example, we’ve set it to display price action in 30-minute periods.
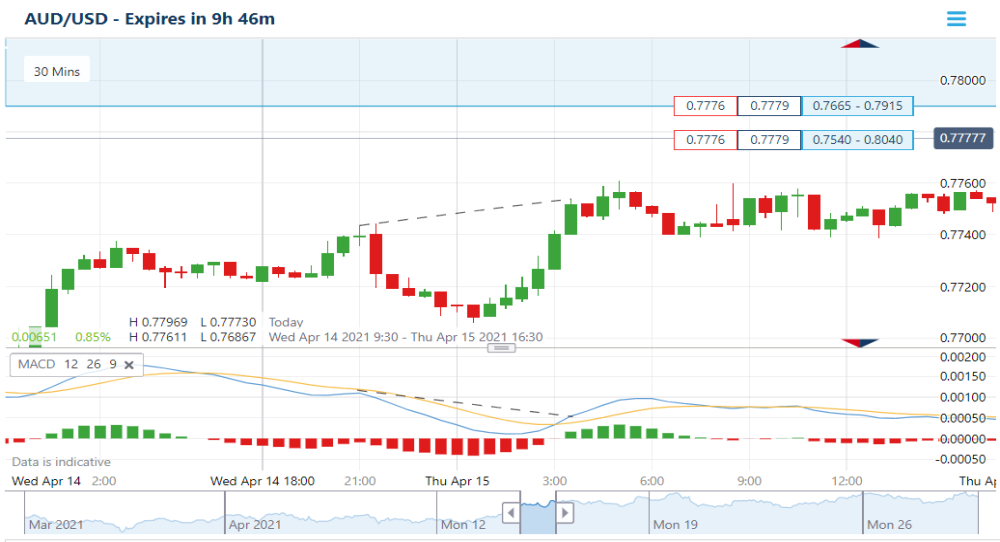
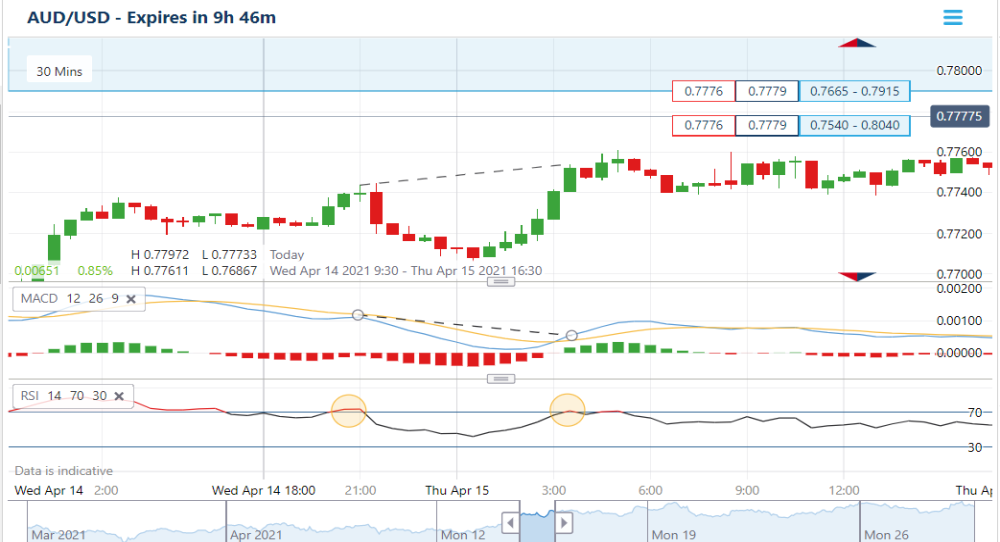
The dotted line on the price chart indicates the market is bullish, while the dotted line on the indicator shows it’s bearish. This means we’ve found a possible divergence. We then selected the RSI indicator as well, and we can see signs of the FX pair being in overbought territory at the orange circles. This makes sense as we see the market price soon levels out and the divergence did not lead to a price reversal.
In the next example, let’s say you’ve spotted a divergence when the market opens on a Sunday at 6 p.m. ET.
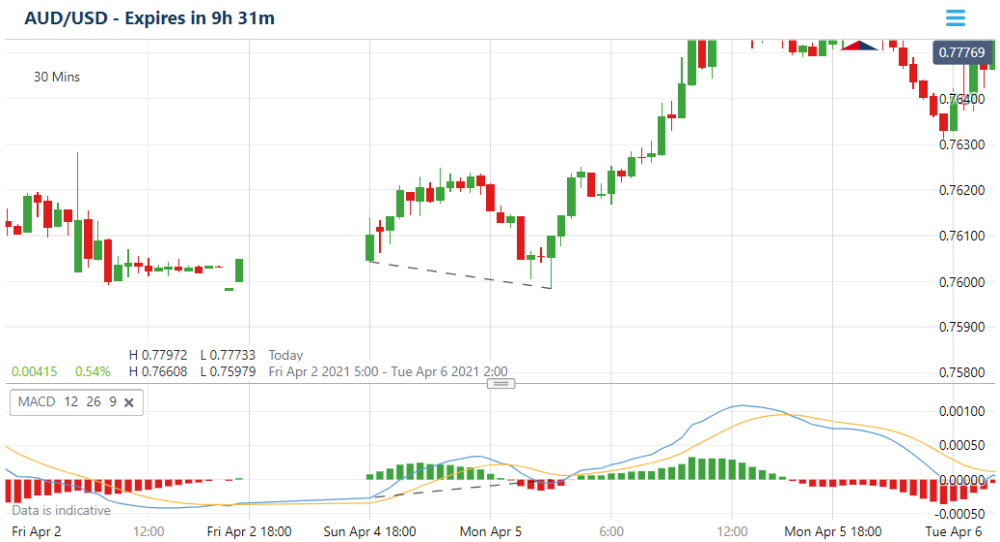
You could then use the RSI indicator to see if this is again a case of the market being in overbought territory.
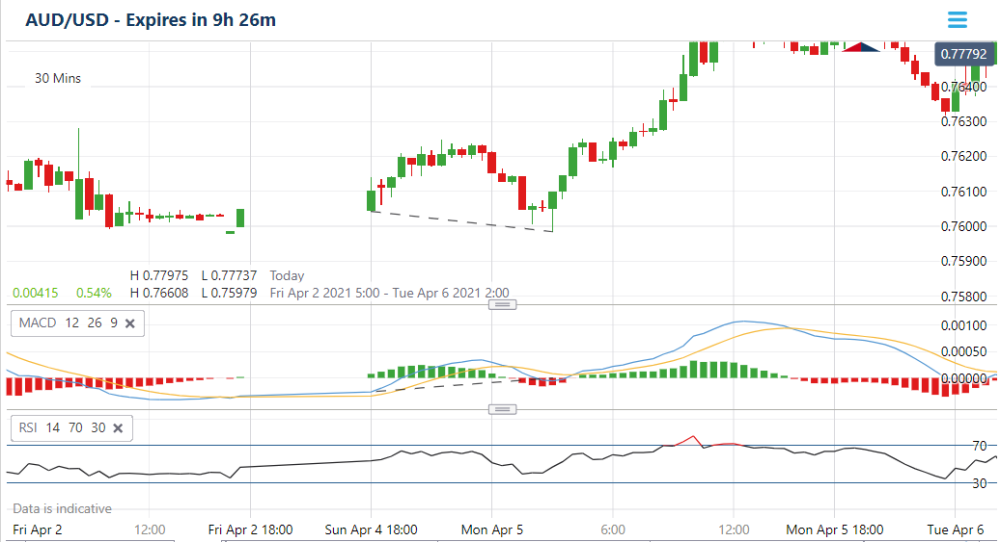
The RSI doesn’t indicate the market is in overbought territory, so we can continue with a divergence day trading strategy. In this case, opening or maintaining a buy position, or taking profits if you’d had a sell position open, would have been appropriate strategies to consider because the bullish trend seen in the MACD predicted an upward change in the market’s price. Of course, even using multiple indicators is not a guarantee you’ll be right about how the market will react when a divergence occurs. That’s why it’s important to have a trading plan and to stick to it, knowing beforehand how you’ll respond when spotting a divergence.